

On this page (2 sections)
The GTM Pipeline Dashboard and Data Mapping Guide shows how DevCommX designs pipeline dashboards that reflect reality, not fragmented data.
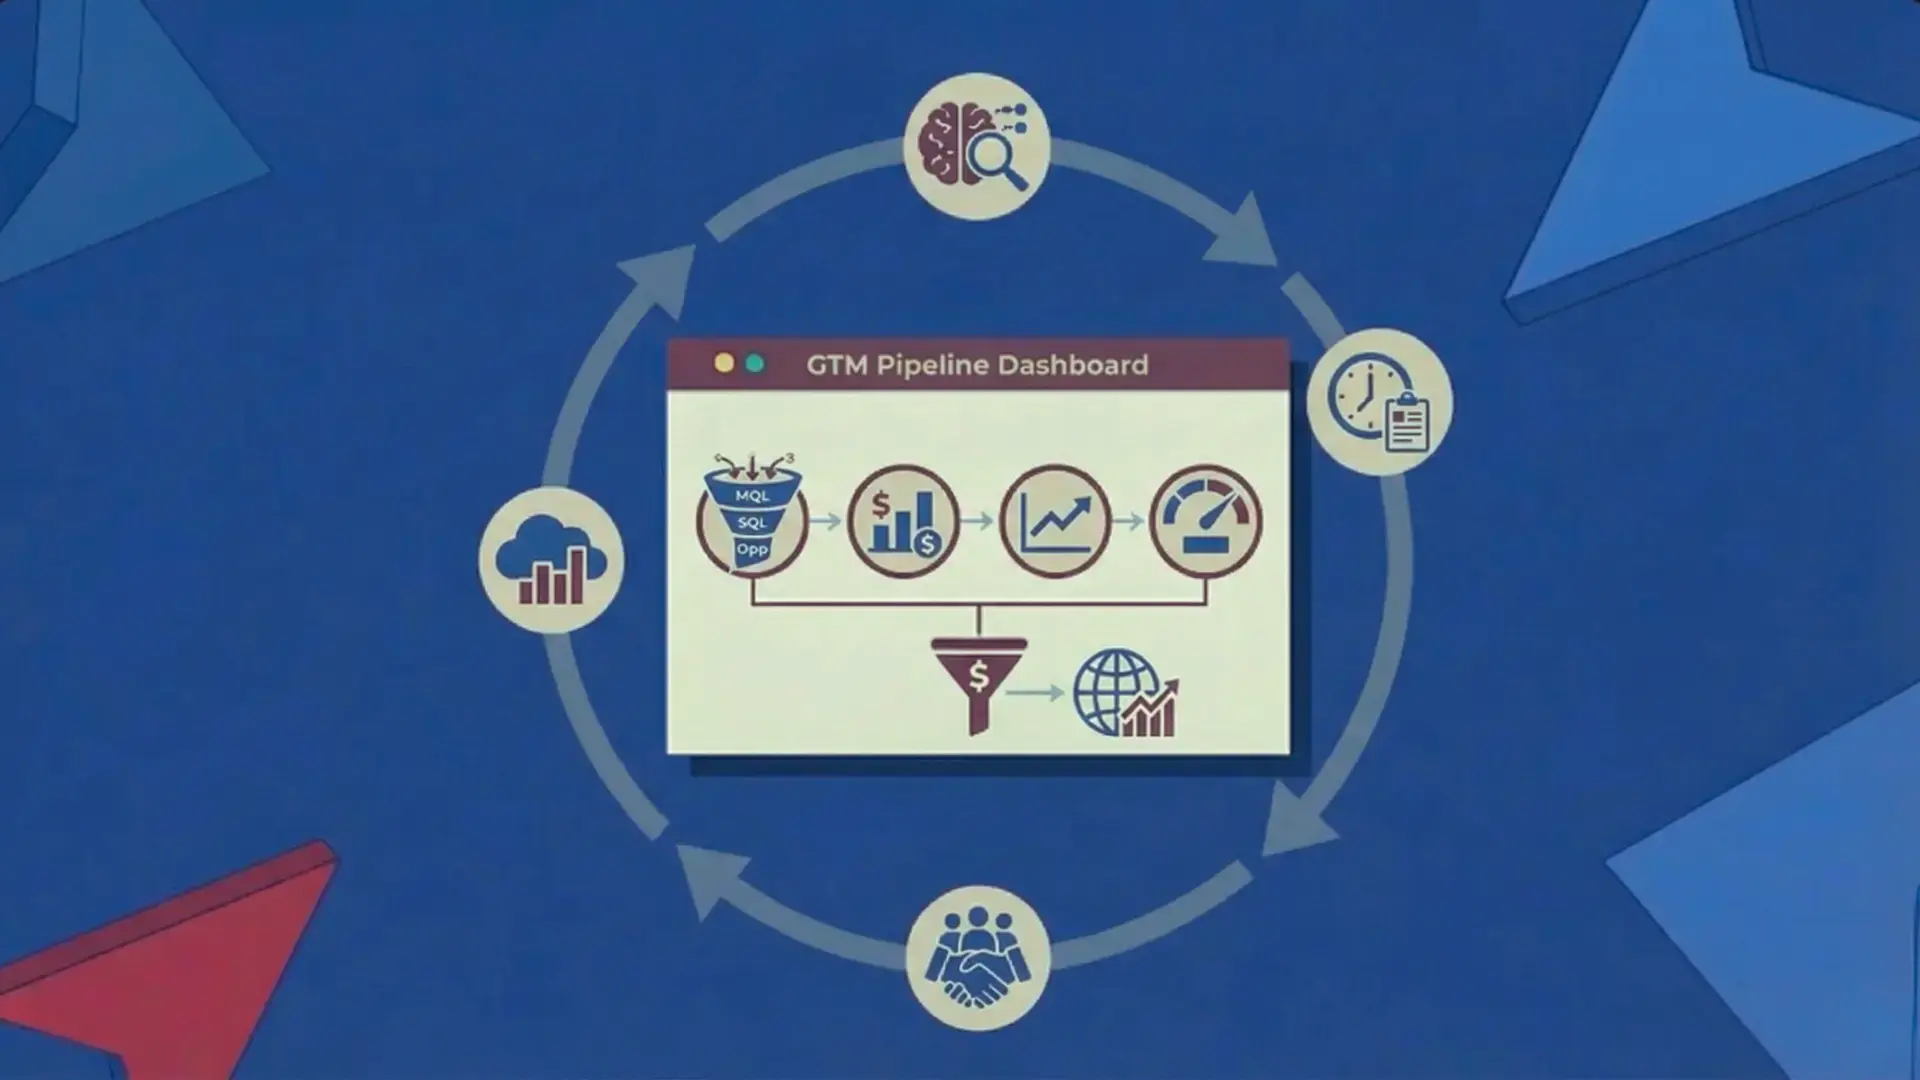
This guide breaks down how to design accurate, scalable GTM pipeline dashboards.
Inside the guide, you’ll learn how to:
- Map GTM data across tools and workflows
- Define pipeline stages that reflect execution reality
- Align inbound, outbound, and sales activity data
- Eliminate reporting gaps and double-countin
- Build dashboards that support daily decisions
- Maintain data integrity as GTM scales
All frameworks are production-tested and optimized for clarity, accuracy, and trust.
Why This Playbook Matters
Bad data leads to bad decisions.
Most pipeline dashboards fail because the underlying data model is broken.
The DevCommX pipeline approach focuses on:
- Data structure before visualization
- Source-of-truth clarity
- Consistent stage definitions
- Dashboards that reflect execution not hope
This guide helps teams build pipeline visibility that supports confident GTM decisions.
Who this playbook is for
- Responsible for forecasting
- Pipeline visibility
- Multi-channel pipelines
- Teams struggling
If pipeline numbers feel unreliable or confusing, this guide shows how to build dashboards you can actually trust.
Book a free 30-minute GTM audit. You leave with a prioritised plan either way.